


Opinion
Jan 29, 2024
What is Commune?
Commune is a product analytics platform for product teams that rely on qualitative data like user feedback in their decision making process. We help product teams analyze their qualitative data by transforming their data into more quantifiable data, visualizing the data on a dashboard, and by providing reports.
Here's a quick demo of what Commune can do:
Commune: Product demo
Now let’s take a look at each key feature.
Transforming data
Qualitative data is generally hard to use within product teams because data across multiple sources is inconsistent. While the issue of gathering data from multiple sources is a clear problem that needs to be solved, the inconsistency of data from these sources is what stood out to us as the main problem for actually using qualitative data efficiently.
Data needs to be cleaned and organized in order for it to be useful. To achieve this, Commune loosely follows the ETL (Extract, Transform, Load) methodology.
We start by looking at the overall data, extracting recurring points over all of the given data. These key points are compared to the existing set of key points, ensuring that similar topics are consolidated into one key point. User feedback is then tagged with these key points, and further analysis (like sentiment analysis) can also be conducted at this point.
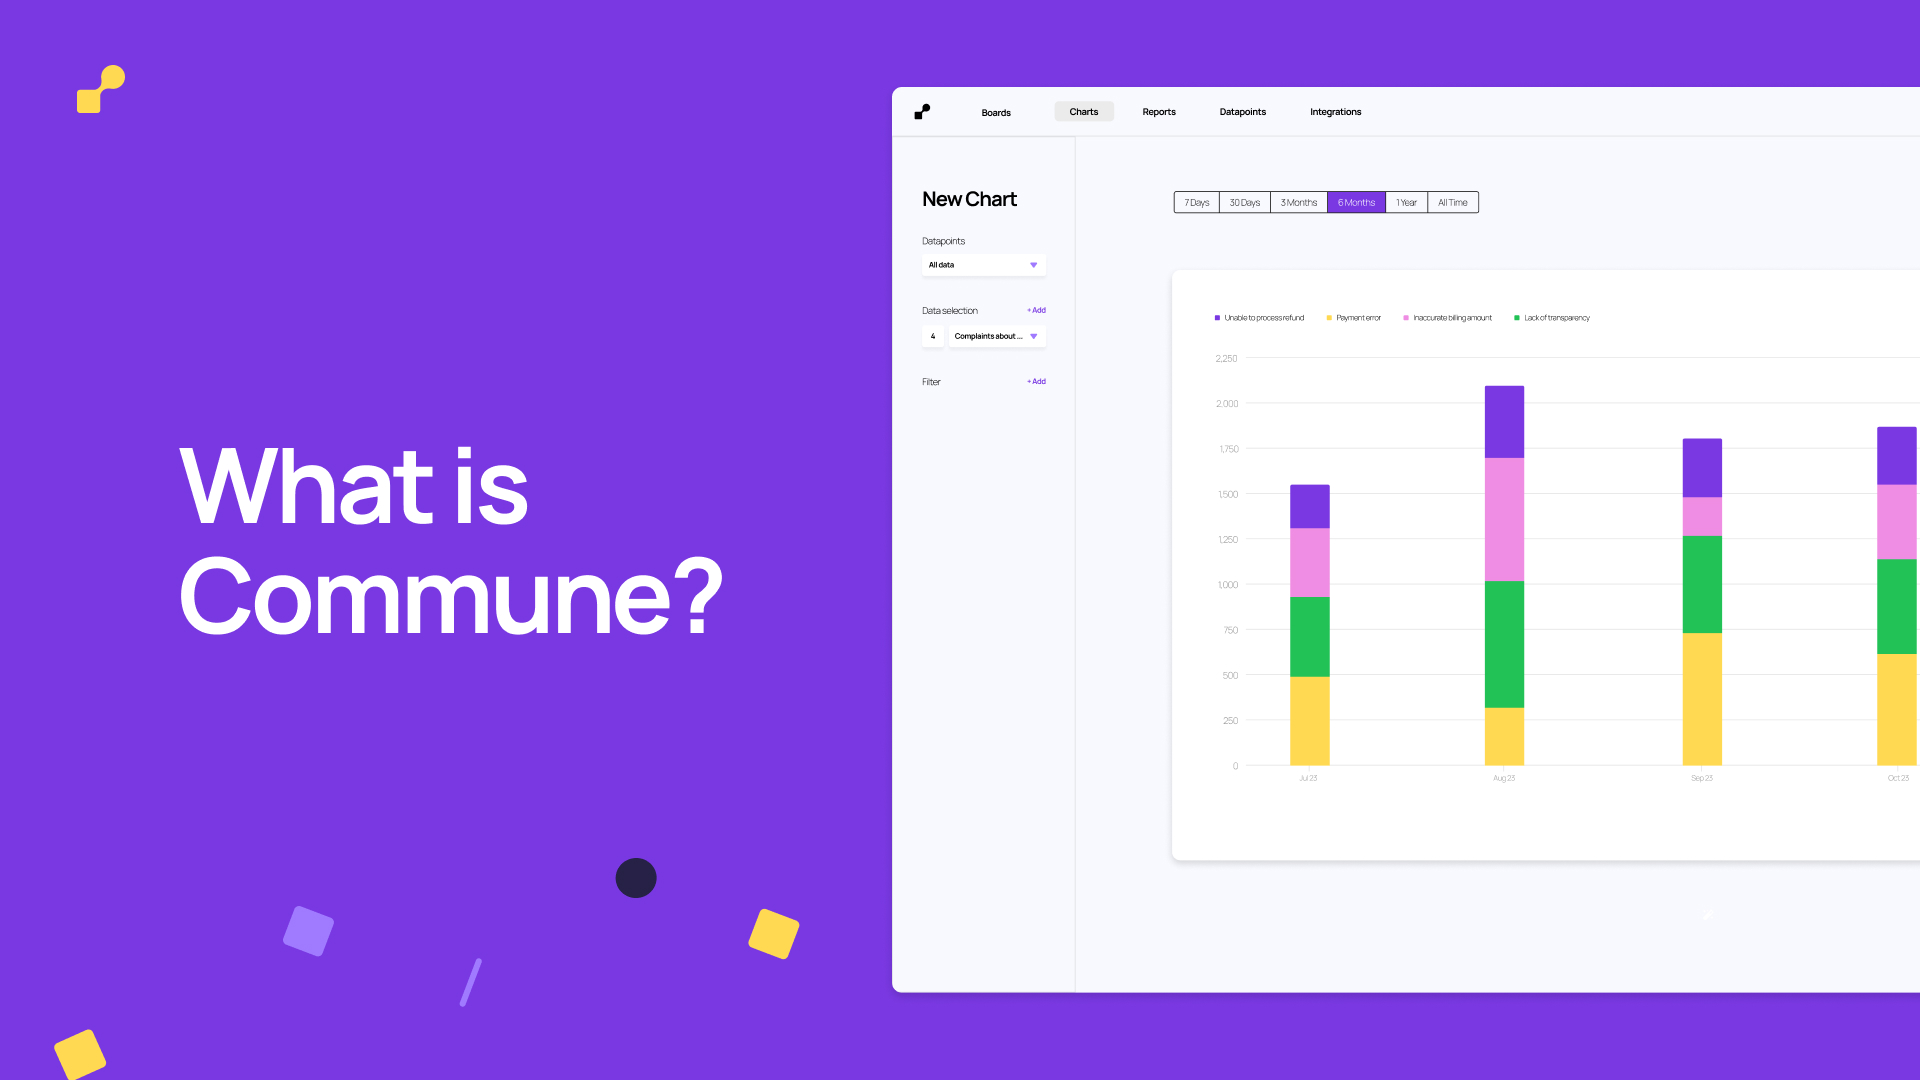
Visualizing data
Since the data has already been tagged with key points and any additional metadata, we can chart this data across various chart types. Charts can be saved into custom dashboards, so product teams can quickly organize their thoughts, and understand their customers at a glance.
One key benefit to combining this approach of visualizing data with the before mentioned method of transforming data, is that charts can be put together at an ad-hoc basis. Have a random question about your users that wasn’t labelled previously? No problem, ask the AI to do an additional analysis and be instantly greeted with a chart that answers your exact question. This gives our product teams the flexibility of exploring their user feedback in a really efficient manner, while still leaving the door open to monitoring data that they find important.
Creating a Commune chart
Providing reports
We find that while generative AI can answer questions in a communicative manner, this doesn’t do quite enough in visualizing a topic or an issue. Thus, Commune instead delivers a report that does use generative AI to come up with a summary, but also responds with things that product teams might find useful. Some of these items are hypothetical user journeys, or notable quotes.
Commune report: Complaints about Billing / Payment
We’re working on building Commune into a tool that gives product teams greater confidence with their product related decisions, and we would love to hear your thoughts and opinions. Reach out to us at hello@commune.cx if you would like to have a quick chat or sign up for a free trial account now to try us out.

